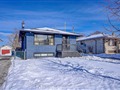
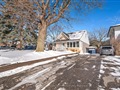
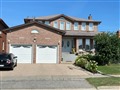
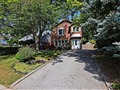
113 Rosemount Dr
$1,236,023
Comparative Market Analysis
Jun 25, 2025
NOT AN ACTIVE LISTING
Historical Performance
| Period | $ Change | % Change |
| 1 Day | +$303 | +0.025% |
| 7 Days | +$87 | +0.007% |
| 30 Days | -$2,414 | -0.195% |
| 3 Months | -$3,630 | -0.293% |
| 6 Months | +$20.9k | +1.72% |
| 1 Year | -$57.2k | -4.42% |
| 3 Years | +$198k | +19.0% |
| 5 Years | +$350k | +39.5% |
| 10 Years | +$740k | +149% |
List My Property
Real Estate Statistics
Financing Solutions
AS SEEN ON


Are You a Licensed Real Estate Agent or Broker?