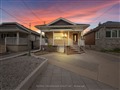
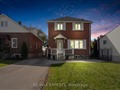
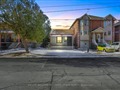
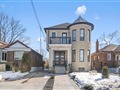
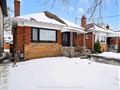
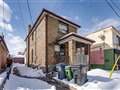
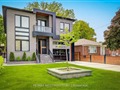
113 Northland Ave
$1,222,405
Comparative Market Analysis
Jul 4, 2025
NOT AN ACTIVE LISTING
Historical Performance
| Period | $ Change | % Change |
| 1 Day | +$311 | +0.025% |
| 7 Days | +$82 | +0.007% |
| 30 Days | -$2,511 | -0.205% |
| 3 Months | -$4,168 | -0.340% |
| 6 Months | +$19.3k | +1.61% |
| 1 Year | -$59.5k | -4.64% |
| 3 Years | +$119k | +10.8% |
| 5 Years | +$317k | +35.0% |
| 10 Years | +$697k | +133% |
List My Property
Real Estate Statistics
Financing Solutions
AS SEEN ON


Are You a Licensed Real Estate Agent or Broker?