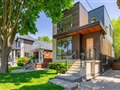
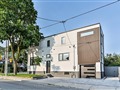
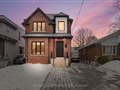
111 Lankin Blvd
$2,278,009
Comparative Market Analysis
Jul 4, 2025
NOT AN ACTIVE LISTING
Historical Performance
| Period | $ Change | % Change |
| 1 Day | +$495 | +0.022% |
| 7 Days | +$2,385 | +0.105% |
| 30 Days | +$7,386 | +0.325% |
| 3 Months | +$35.5k | +1.58% |
| 6 Months | +$135k | +6.28% |
| 1 Year | +$148k | +6.93% |
| 3 Years | +$1.14m | +101% |
| 5 Years | +$1.38m | +155% |
| 10 Years | +$1.74m | +326% |
List My Property
Real Estate Statistics
Financing Solutions
Browsing History
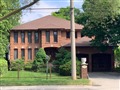
99 Birkdale Rd, Toronto
4 seconds ago
AS SEEN ON


Are You a Licensed Real Estate Agent or Broker?