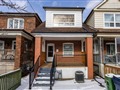
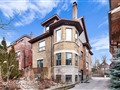
111 Ashburnham Rd
$1,437,109
Comparative Market Analysis
Jul 6, 2025
NOT AN ACTIVE LISTING
Historical Performance
| Period | $ Change | % Change |
| 1 Day | +$349 | +0.024% |
| 7 Days | +$54 | +0.004% |
| 30 Days | -$3,003 | -0.209% |
| 3 Months | -$4,795 | -0.333% |
| 6 Months | +$23.2k | +1.64% |
| 1 Year | -$69.3k | -4.60% |
| 3 Years | +$74.2k | +5.44% |
| 5 Years | +$269k | +23.1% |
| 10 Years | +$788k | +121% |
List My Property
Real Estate Statistics
Financing Solutions
AS SEEN ON


Are You a Licensed Real Estate Agent or Broker?