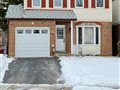
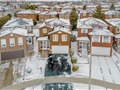
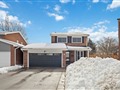
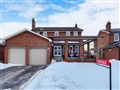
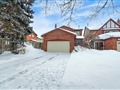
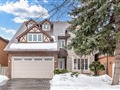
110 Seagrave Cres
$1,200,376
Comparative Market Analysis
Jun 6, 2025
NOT AN ACTIVE LISTING
Historical Performance
| Period | $ Change | % Change |
| 1 Day | +$275 | +0.023% |
| 7 Days | +$222 | +0.018% |
| 30 Days | -$1,457 | -0.121% |
| 3 Months | -$128 | -0.011% |
| 6 Months | +$28.2k | +2.41% |
| 1 Year | -$35.5k | -2.87% |
| 3 Years | +$250k | +26.3% |
| 5 Years | +$432k | +56.2% |
| 10 Years | +$713k | +146% |
List My Property
Real Estate Statistics
Financing Solutions
Browsing History
3085 Bloor St W 301, Toronto
1 second ago
89 Ambercroft Blvd, Toronto
2 seconds ago
52 Shudell Ave, Toronto
3 seconds ago
242 John Garland Blvd 20, Toronto
4 seconds ago
185 Fundy Bay Blvd, Toronto
5 seconds ago
138 St. Helens Ave 506, Toronto
6 seconds ago
22 Chadbury Pl, Toronto
7 seconds ago
102 Bloor St W 1603, Toronto
8 seconds ago
260 John Garland Blvd 228, Toronto
10 seconds ago
1830 Bloor St W 335, Toronto
11 seconds ago
AS SEEN ON


Are You a Licensed Real Estate Agent or Broker?