($title)
($content)
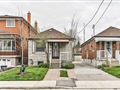
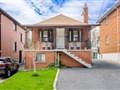
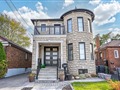
11 Seneca Ave
$873,640
Comparative Market Analysis
May 2, 2024
NOT AN ACTIVE LISTING
Historical Performance
| Period | $ Change | % Change |
| 1 Day | +$222 | +0.025% |
| 7 Days | +$6 | +0.001% |
| 30 Days | -$2,053 | -0.234% |
| 3 Months | -$3,807 | -0.434% |
| 6 Months | +$12.1k | +1.41% |
| 1 Year | -$46.3k | -5.03% |
| 3 Years | +$73.3k | +9.16% |
| 5 Years | +$204k | +30.4% |
| 10 Years | +$458k | +110% |
List My Property
Request Sold History
Real Estate Statistics
Financing Solutions
AS SEEN ON

FOR SALE
FOR RENT
LIST PROPERTY FOR SALE
Property Type
Barrie 675
Brampton 1.30k
Burlington 429
Caledon 329
Hamilton 1.27k
Kawartha Lakes 518
London 635
Markham 632
Mississauga 1.50k
Oakville 678
Oshawa 423
Richmond Hill 696
Toronto 7.67k
Annex 220
Mimico 249
see all
Vaughan 928
Bedrooms
Bathrooms
Search Listings
Save Graph
How is this Graph Generated?
GRAPH AND COMPARATIVE MARKET ANALYSIS (CMA) METHODOLOGY
The CMA graph for 11 Seneca Ave is based on Toronto 365-day running median for 2+2-bedroom, 2-bathroom
detached house properties and adjusted for sold comparables in the area. This CMA does not reflect recent home improvements that may have been done to this property.
The CMA represents a seasonally adjusted long term valuation trends and may not immediately reflect short term market fluctuations. If you are interested in raw
monthly real estate market statistics and short term market fluctuations, please refer to
real estate statistics for Toronto.
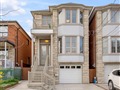
SIMILAR PROPERTIES FOR SALE
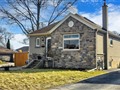
Charming, Clean & Renovated BungalowHome On An Oversized 133' Deep Lot On A Builder Friendly Street! This Home Features An Updated Kitchen With...
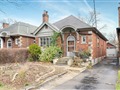
Experience timeless charm and versatility with this Tudor-style detached bungalow nestled on the most coveted street in the area. Steeped in original...
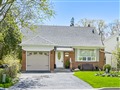
Welcome to a hidden gem in the coveted Scarlett & St. Clair community of Toronto! Nestled against the picturesque backdrop of the renowned Lambton...
Alternative To Condo Living! Newly Reno'd Stone & Stucco Loft Style Detached Bungalow! Large Corner Lot, Stunning Open Concept Living/Dining/Gourmet...
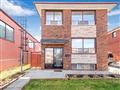
Don't miss out on this exceptional property a beautifully renovated 3-bedroom brick bungalow on a 30x120ft. lot. It includes a spacious 20x24 double...
Great opportunity to own this property on a rarely available location in a family-friendly neighbourhood. This property can be a great start-up home...
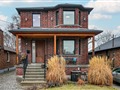
Bring Your Golf Clubs 500 Feet From Lambton Golf + Country Club. Renovated Bungalow With Nanny Suite Pot Lights Large Kitchen With Space. The Furnace...
Location! Location! Location! Welcome to a well maintained detached home in a prime location of Rockcliffe-Smythe in Toronto. This ready to move-in...
Welcome to this spectacular home built in 2016 with a captivating stone facade! This rarely offered gem features over 3000 sf of finished living...
This Stunning 3 Bedroom Property on a 231-Foot Deep lot will make you feel you're at the cottage. The home blends classic charm with modern luxury in...
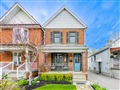
Well Maintained 2 Storey Detached Home In Rockcliffe Smythe. Main Floor Features Kitchen With Eat In Area And Walkout To Concrete Porch. Combined...
Perched on top a ravine setting, this custom-built detached red brick stunner strikes the right balance between style and practicality. Step inside...
Spectacular Home & perfect for your family! Almost 4000sqft of livable space. Open concept Kitchen, living & dining. Gourmet Kitchen with quartz...
Modern/Contemporary Pre-Construction Home. Design Features A Sleek Eat-In Kitchen with Upgraded Modern Appliances, cabinets & Surfaces. Open Concept...
Welcome To Over 4100 Sqft Brand New Masterpiece Home. Where Elegance And Sophistication Come Together To Create This Exceptional Residence On A...
2+2
BEDROOMS
2
BATHROOMS
1+1
KITCHENS
ADDRESS
PROPERTY TYPE
Detached House
LOT SIZE20.00 x 112.00
STATUSNOT AN ACTIVE LISTING
COMPARATIVE MARKET ANALYSIS
$873,640
Refinance Your Property
Comparative Market Analysis of 11 Seneca Ave is based on market trends for Rockcliffe-Smythe community of Toronto community and recent sales in the area.
The sold statistics information is provided by Toronto Real Estate Board (Reference: Competition Bureau vs. TREB in Federal Court of Appeal - 27 April, 2016;
TREB's appeal was dismissed and it is now mandated to provide sold data to the public).
Comparative Market Analysis is provided for reference purposes only and may be
different from the actual market sold price or an appraised value. Comparative Market Analysis does not take into account recent home improvements that have been
carried out to the property. Listing.ca does not bare any responsibility to the accuracy of the provided opinion. The graph represents a seasonally
adjusted long term valuation trends and may not immediately reflect short term market fluctuations.
SALES HISTORY
SOLD COMPARABLES
MARKET STATS
XX/XX/20XX
SOLD
$XXX,100
XX/XX/20XX
SOLD
$XXX,000
XX/XX/20XX
SOLD
$XXX,000
XX/XX/20XX
SOLD
$XXX,000
XX/XX/20XX
SOLD
$XXX,000
Request Sold History
2+2 Beds
2 Baths
Sold Price
$725,000
List Price
$599,900
Sold Date
02/08/2024
DOM
XX Days
2+3 Beds
2 Baths
Sold Price
$570,000
List Price
$649,900
Sold Date
11/21/2023
DOM
XX Days
2+2 Beds
2 Baths
Sold Price
$950,000
List Price
$975,000
Sold Date
02/22/2024
DOM
XX Days
2+2 Beds
2 Baths
Sold Price
$739,999
List Price
$799,000
Sold Date
02/13/2024
DOM
XX Days
2+1 Beds
2 Baths
Sold Price
$885,000
List Price
$698,000
Sold Date
02/09/2024
DOM
XX Days
Request All 93 Sold Comparables
PROPERTY DESCRIPTION
11 Seneca Ave is a 2+2-bedroom 2-washroom detached house located in Rockcliffe-Smythe community of Toronto. It is currently NOT FOR SALE, but is
worth in our opinion around $873,640
.
The property is situated on a 20' frontage by 112' deep lot. 11 Seneca Ave is currently not for sale and is not an active listing on Listing.ca.
NEARBY MEDICAL CENTRES
The property is situated on a 20' frontage by 112' deep lot. 11 Seneca Ave is currently not for sale and is not an active listing on Listing.ca.
Mount Dennis Medical Group 1.3 km
98 Guestville Ave, M6N4N6
Phone: (416) 763-1171
NEARBY GROCERY STORES
98 Guestville Ave, M6N4N6
Phone: (416) 763-1171
Kim's Grocery 0.6 km
878 Weston Rd, M6N3R7
Phone: (416) 766-6924
NEARBY GAS STATIONS
878 Weston Rd, M6N3R7
Phone: (416) 766-6924
Husky Gas Station 1.4 km
2492 St Clair Ave W, M6N1L3
Phone: (416) 763-3535 Pioneer Petroleums 1.4 km
2317 St Clair Ave W, M6N1K9
Phone: (416) 766-2619
NEARBY COFFEE SHOPS
2492 St Clair Ave W, M6N1L3
Phone: (416) 763-3535 Pioneer Petroleums 1.4 km
2317 St Clair Ave W, M6N1K9
Phone: (416) 766-2619
Express Country Style 1.4 km
2317 St. Clair Ave W, M6N1K9
Phone: (416) 766-2619
2317 St. Clair Ave W, M6N1K9
Phone: (416) 766-2619
Are You a Licensed Real Estate Agent or Broker?
© 2011-2024 Real Estate Bay Realty Inc, Brokerage
The information provided herein must only be used by consumers that have a bona fide interest in the purchase, sale, or lease of real estate and may not be used for any commercial or any other purpose. Information is deemed reliable but is not guaranteed accurate by TREB, Listing.ca or Real Estate Bay Realty, Brokerage.
The trademarks MLS®, Multiple Listing Service® and the associated logos are owned by The Canadian Real Estate Association (CREA) and identify the quality of services provided by real estate professionals who are members of CREA. Used under license.
Real Estate Bay Realty, Brokerage
220 Duncan Mill Road, Suite 209
Toronto, ON M3B 3J5
Phone: 416-800-1055
info@listing.ca Listing.ca on Twitter
RealEstateBay.ca on Facebook
220 Duncan Mill Road, Suite 209
Toronto, ON M3B 3J5
Phone: 416-800-1055
info@listing.ca Listing.ca on Twitter
RealEstateBay.ca on Facebook