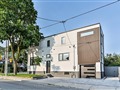
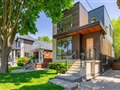
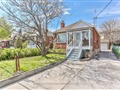
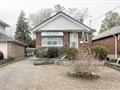
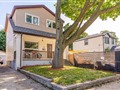
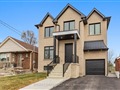
11 Norlong Blvd
$1,170,721
Comparative Market Analysis
Jun 20, 2025
NOT AN ACTIVE LISTING
Historical Performance
| Period | $ Change | % Change |
| 1 Day | +$254 | +0.022% |
| 7 Days | -$76 | -0.007% |
| 30 Days | -$2,744 | -0.234% |
| 3 Months | -$4,368 | -0.372% |
| 6 Months | +$18.4k | +1.60% |
| 1 Year | -$58.2k | -4.73% |
| 3 Years | +$131k | +12.6% |
| 5 Years | +$278k | +31.1% |
| 10 Years | +$658k | +129% |
List My Property
Real Estate Statistics
Financing Solutions
Browsing History
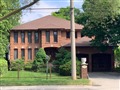
9 Harefield Dr, Toronto
1 second ago
AS SEEN ON


Are You a Licensed Real Estate Agent or Broker?