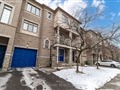
80 Bridgeport Dr
$1,083,241
Comparative Market Analysis
Jun 13, 2025
NOT AN ACTIVE LISTING
Historical Performance
| Period | $ Change | % Change |
| 1 Day | +$598 | +0.055% |
| 7 Days | +$1,523 | +0.141% |
| 30 Days | -$1,668 | -0.154% |
| 3 Months | -$5,721 | -0.525% |
| 6 Months | +$13.5k | +1.26% |
| 1 Year | -$54.9k | -4.82% |
| 3 Years | +$164k | +17.8% |
| 5 Years | +$285k | +35.8% |
| 10 Years | +$570k | +111% |
List My Property
Real Estate Statistics
Financing Solutions
AS SEEN ON

Are You a Licensed Real Estate Agent or Broker?