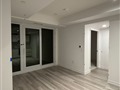
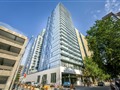
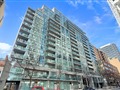
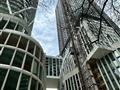
73 Mccartney St 537
$552,038
Comparative Market Analysis
May 15, 2025
NOT AN ACTIVE LISTING
Historical Performance
| Period | $ Change | % Change |
| 1 Day | +$404 | +0.073% |
| 7 Days | +$232 | +0.042% |
| 30 Days | +$345 | +0.063% |
| 3 Months | -$1,437 | -0.260% |
| 6 Months | +$4,826 | +0.882% |
| 1 Year | -$30.1k | -5.17% |
| 3 Years | +$33.4k | +6.43% |
| 5 Years | +$83.8k | +17.9% |
| 10 Years | +$249k | +82.4% |
List My Property
Real Estate Statistics
Financing Solutions
Browsing History
5 Parkway Forest Dr 1808, Toronto
2 seconds ago
7 Sawmill Rd, Toronto
3 seconds ago
56 Forest Manor Rd 204, Toronto
4 seconds ago
53 Mccartney St 345, Toronto
5 seconds ago
87 Tranmer Ave, Toronto
6 seconds ago
203 Orton Park Rd, Toronto
7 seconds ago
62 Forest Manor Rd 2210, Toronto
8 seconds ago
73 Mccartney St 428, Toronto
9 seconds ago
70 Roehampton Ave 315, Toronto
10 seconds ago
371 Orton Park Rd 122, Toronto
11 seconds ago
AS SEEN ON


Are You a Licensed Real Estate Agent or Broker?