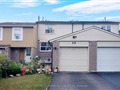
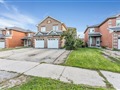
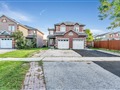
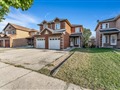
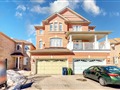
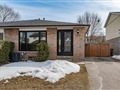
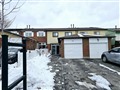
73 Lowry Sq
$913,877
Comparative Market Analysis
Jun 30, 2025
NOT AN ACTIVE LISTING
Historical Performance
| Period | $ Change | % Change |
| 1 Day | +$496 | +0.054% |
| 7 Days | +$1,374 | +0.151% |
| 30 Days | -$687 | -0.075% |
| 3 Months | -$2,452 | -0.268% |
| 6 Months | +$16.1k | +1.79% |
| 1 Year | -$35.9k | -3.78% |
| 3 Years | +$172k | +23.2% |
| 5 Years | +$306k | +50.3% |
| 10 Years | +$600k | +192% |
List My Property
Real Estate Statistics
Financing Solutions
Browsing History
1140 Brimley Rd, Toronto
1 second ago
206 Meadowvale Dr, Toronto
2 seconds ago
AS SEEN ON


Are You a Licensed Real Estate Agent or Broker?