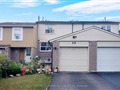
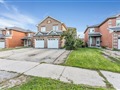
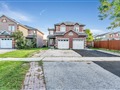
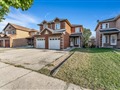
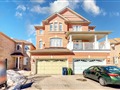
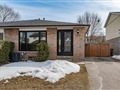
71 Lowry Sq
$831,056
Comparative Market Analysis
May 10, 2025
NOT AN ACTIVE LISTING
Historical Performance
| Period | $ Change | % Change |
| 1 Day | +$451 | +0.054% |
| 7 Days | +$1,171 | +0.141% |
| 30 Days | -$1,010 | -0.121% |
| 3 Months | -$3,467 | -0.415% |
| 6 Months | +$12.1k | +1.48% |
| 1 Year | -$38.3k | -4.40% |
| 3 Years | +$139k | +20.1% |
| 5 Years | +$249k | +42.7% |
| 10 Years | +$501k | +152% |
List My Property
Real Estate Statistics
Financing Solutions
Browsing History
4645 Jane St 537, Toronto
1 second ago
4645 Jane St 540, Toronto
1 second ago
4645 Jane St 526, Toronto
2 seconds ago
154 Benson Ave, Toronto
2 seconds ago
735 Don Mills Rd 2304, Toronto
2 seconds ago
78 Carr St 23, Toronto
2 seconds ago
4645 Jane St 1105, Toronto
3 seconds ago
5 Mariner Terr 2710, Toronto
3 seconds ago
78 Carr St 20, Toronto
3 seconds ago
4645 Jane St 1107, Toronto
4 seconds ago
AS SEEN ON


Are You a Licensed Real Estate Agent or Broker?