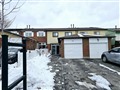
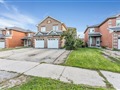
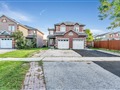
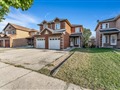
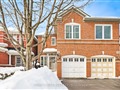
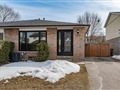
66 Lowry Sq
$978,397
Comparative Market Analysis
Jul 1, 2025
NOT AN ACTIVE LISTING
Historical Performance
| Period | $ Change | % Change |
| 1 Day | +$531 | +0.054% |
| 7 Days | +$1,317 | +0.135% |
| 30 Days | -$1,489 | -0.152% |
| 3 Months | -$5,053 | -0.514% |
| 6 Months | +$12.2k | +1.27% |
| 1 Year | -$49.6k | -4.83% |
| 3 Years | +$159k | +19.4% |
| 5 Years | +$298k | +43.8% |
| 10 Years | +$620k | +173% |
List My Property
Real Estate Statistics
Financing Solutions
Browsing History
50 Ordnance St 1409, Toronto
2 seconds ago
18 Park Blvd, Toronto
3 seconds ago
7 King St E 2315, Toronto
4 seconds ago
26 Gardiner Rd, Toronto
5 seconds ago
7 King St E 1511, Toronto
6 seconds ago
1592 Islington Ave, Toronto
7 seconds ago
Norris Cres, Toronto
8 seconds ago
74 Sunnypoint Cres, Toronto
9 seconds ago
45 Woburn Ave, Toronto
10 seconds ago
2835 Islington Ave 211, Toronto
11 seconds ago
AS SEEN ON


Are You a Licensed Real Estate Agent or Broker?