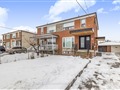
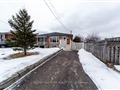
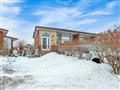
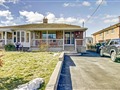
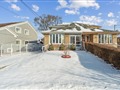
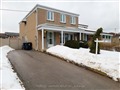
63 Cobb Ave
$1,051,915
Comparative Market Analysis
Jun 24, 2025
NOT AN ACTIVE LISTING
Historical Performance
| Period | $ Change | % Change |
| 1 Day | +$575 | +0.055% |
| 7 Days | +$1,510 | +0.144% |
| 30 Days | -$1,282 | -0.122% |
| 3 Months | -$4,426 | -0.419% |
| 6 Months | +$15.3k | +1.48% |
| 1 Year | -$48.4k | -4.40% |
| 3 Years | +$155k | +17.3% |
| 5 Years | +$289k | +37.9% |
| 10 Years | +$604k | +135% |
List My Property
Real Estate Statistics
Financing Solutions
Browsing History
125 Blue Jays Way 3107, Toronto
1 second ago
115 Antibes Dr 808, Toronto
2 seconds ago
107 Felbrigg Ave, Toronto
2 seconds ago
9 Westridge Rd, Toronto
2 seconds ago
29 Rameau Dr, Toronto
3 seconds ago
AS SEEN ON


Are You a Licensed Real Estate Agent or Broker?