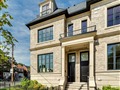
63 Burnaby Blvd
$2,022,582
Comparative Market Analysis
Feb 1, 2025
NOT AN ACTIVE LISTING
Historical Performance
| Period | $ Change | % Change |
| 1 Day | +$1,222 | +0.060% |
| 7 Days | +$3,513 | +0.174% |
| 30 Days | -$3,319 | -0.164% |
| 3 Months | -$12.0k | -0.589% |
| 6 Months | +$24.9k | +1.25% |
| 1 Year | -$102k | -4.80% |
| 3 Years | +$317k | +18.6% |
| 5 Years | +$561k | +38.4% |
| 10 Years | +$1.09m | +118% |
List My Property
Real Estate Statistics
Financing Solutions
AS SEEN ON

Are You a Licensed Real Estate Agent or Broker?