($title)
($content)
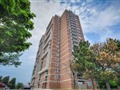
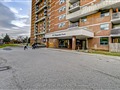
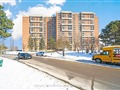
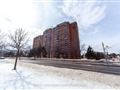
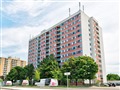
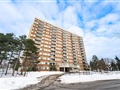
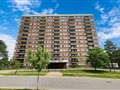
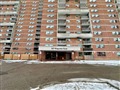
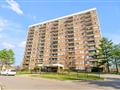
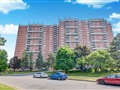
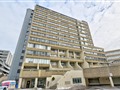
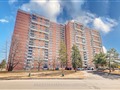
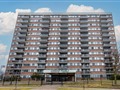
6 Rosebank Dr 11C
$590,596
Comparative Market Analysis
May 18, 2025
NOT AN ACTIVE LISTING
Historical Performance
| Period | $ Change | % Change |
| 1 Day | +$386 | +0.065% |
| 7 Days | +$268 | +0.045% |
| 30 Days | +$88 | +0.015% |
| 3 Months | -$1,689 | -0.285% |
| 6 Months | +$5,778 | +0.988% |
| 1 Year | -$31.7k | -5.10% |
| 3 Years | +$91.0k | +18.2% |
| 5 Years | +$172k | +41.1% |
| 10 Years | +$339k | +135% |
List My Property
Request Sold History
Real Estate Statistics
Financing Solutions
AS SEEN ON

FOR SALE
FOR RENT
LIST PROPERTY FOR SALE
Property Type
Barrie 703
Brampton 1.63k
Burlington 529
Hamilton 1.37k
Kingston 434
London 1.06k
Markham 880
Milton 427
Mississauga 1.83k
Oakville 989
Oshawa 510
Richmond Hill 786
St. Catharines 431
Toronto 8.20k
Mimico 246
Willowdale East 252
see all
Vaughan 1.07k
Bedrooms
Bathrooms
Price Range
Minimum
$50k 16.3k
$100k 16.3k
$150k 16.3k
$200k 16.3k
$300k 16.3k
$400k 16.2k
$500k 15.4k
$600k 14.1k
$700k 12.9k
$800k 12.1k
$900k 11.5k
$1.00m 11.0k
$1.25m 10.3k
$1.50m 9.75k
$1.75m 9.45k
$2.00m 9.15k
$2.50m 8.87k
$3.00m 8.62k
$4.00m 8.44k
$5.00m 8.34k
$7.50m 8.24k
$10.0m 8.20k
$15.0m 8.18k
$20.0m 8.17k
$30.0m 8.17k
$50k 8.16k
$100k 8.14k
$150k 8.13k
$200k 8.13k
$300k 8.12k
$400k 7.99k
$500k 7.27k
$600k 5.92k
$700k 4.75k
$800k 3.92k
$900k 3.34k
$1.00m 2.79k
$1.25m 2.14k
$1.50m 1.58k
$1.75m 1.29k
$2.00m 988
$2.50m 710
$3.00m 460
$4.00m 275
$5.00m 175
$7.50m 71
$10.0m 38
$15.0m 16
$20.0m 6
$30.0m 1
Maximum
$50k 0
$100k 25
$150k 30
$200k 30
$300k 40
$400k 173
$500k 893
$600k 2.25k
$700k 3.42k
$800k 4.24k
$900k 4.82k
$1.00m 5.37k
$1.25m 6.02k
$1.50m 6.58k
$1.75m 6.88k
$2.00m 7.18k
$2.50m 7.45k
$3.00m 7.70k
$4.00m 7.89k
$5.00m 7.99k
$7.50m 8.09k
$10.0m 8.13k
$15.0m 8.15k
$20.0m 8.16k
$30.0m 8.16k
$50k 8.16k
$100k 8.19k
$150k 8.19k
$200k 8.19k
$300k 8.20k
$400k 8.34k
$500k 9.06k
$600k 10.4k
$700k 11.6k
$800k 12.4k
$900k 13.0k
$1.00m 13.5k
$1.25m 14.2k
$1.50m 14.7k
$1.75m 15.0k
$2.00m 15.3k
$2.50m 15.6k
$3.00m 15.9k
$4.00m 16.1k
$5.00m 16.2k
$7.50m 16.3k
$10.0m 16.3k
$15.0m 16.3k
$20.0m 16.3k
$30.0m 16.3k
Search Listings
Save Graph
How is this Graph Generated?
GRAPH AND COMPARATIVE MARKET ANALYSIS (CMA) METHODOLOGY
The CMA graph for 6 Rosebank Dr 11C is based on Toronto 365-day running median for 2-bedroom, 2-bathroom
condo apartment properties and adjusted for sold comparables in the area. This CMA does not reflect recent home improvements that may have been done to this property.
The CMA represents a seasonally adjusted long term valuation trends and may not immediately reflect short term market fluctuations. If you are interested in raw
monthly real estate market statistics and short term market fluctuations, please refer to
real estate statistics for Toronto.
SIMILAR PROPERTIES FOR SALE
Newly Renovated 2 Bedroom 2 Washroom Unit In A High-Demand Building & Area. Open Concept Layout. Featuring Balcony With Great Panoramic Views...
Breathtaking Panoramic Views A Rare Opportunity You Won't Want to Miss! This fully upgraded 2-bedroom condo is a true gem, offering a spacious...
Rare opportunity to own this beautiful, spacious, recently renovated 2 bedroom & 2 washroom unit in a high demand area in Toronto. This open concept...
Excellent Opportunity To Own a Fully Renovated Condo Unit For, First time Buyers and Investors. This spacious unit, between 1000 to 1200 sq. ft., is...
Modern contemporary style, freshly renovated 2 bed & 2 baths unit. $$$ spent on brand new laminate and porcelain flooring, kitchen cabinet, quartz...
Affordable 2-Bed, 2-Bath Condo in a Prime Location, Scarborough! This east-facing condo offers spacious living at an unbeatable price. Featuring...
Discover this incredibly affordable and beautiful 2-bedroom, 2-bathroom condo in a highly sought-after location! This well-maintained, clean unit...
***POWER OF SALE*** Discover the potential of this exceptional power-of-sale opportunity. This spacious 2-bedroom, 2-bathroom condo is being sold as...
Welcome to this exceptional 2-bedroom, 2-bathroom condo located just a 30 seconds walk from Malvern Town Centre! This prime spot offers unparalleled...
One Of the" Largest 3 Bedroom Unit" Is For Sale! In High Demand Area Of Scarborough. Excellent & Fully Renovated Condo Unit. Spacious Front Hall...
Fully renovated three-bedroom Condo in a prime Toronto location. Three full-size bedrooms, a newly laminated floor, and a large solarium for your...
This is an excellent opportunity to own a fully renovated condo unit, ideal for first-time buyers and investors. This spacious unit, measuring...
Wake up to the sunrise in your east facing & conveniently located 1 bedroom condo. Functional floor plan & stainless steel appliances. Property...
Beautiful Condo, In a Most Desirable Area. Stunning Open Concept 1+ 1 Bedroom, Laminate floors. Large Balcony with Unobstructed Incredible view. Very...
Location!! Discover The Ultimate In Convenience And Corner Unit. This Beautiful Modern Condo. This Condo Features 1 + 1 Bedroom 1 Washroom With...
2
BEDROOMS
2
BATHROOMS
1
KITCHENS
ADDRESS
PROPERTY TYPE
Condo Apartment
STATUSNOT AN ACTIVE LISTING
COMPARATIVE MARKET ANALYSIS
$590,596
Refinance Your Property
Comparative Market Analysis of 6 Rosebank Dr 11C is based on market trends for Malvern community of Toronto community and recent sales in the area.
The sold statistics information is provided by Toronto Real Estate Board (Reference: Competition Bureau vs. TREB in Federal Court of Appeal - 27 April, 2016;
TREB's appeal was dismissed and it is now mandated to provide sold data to the public).
Comparative Market Analysis is provided for reference purposes only and may be
different from the actual market sold price or an appraised value. Comparative Market Analysis does not take into account recent home improvements that have been
carried out to the property. Listing.ca does not bare any responsibility to the accuracy of the provided opinion. The graph represents a seasonally
adjusted long term valuation trends and may not immediately reflect short term market fluctuations.
SALES HISTORY
MARKET STATS
XX/XX/20XX
SOLD
$XXX,000
XX/XX/20XX
SOLD
$XXX,000
Request Sold History
PROPERTY DESCRIPTION
6 Rosebank Dr 11C is a 2-bedroom 2-washroom condo apartment located in Malvern community of Toronto. It is currently NOT FOR SALE, but is
worth in our opinion around $590,596
.
6 Rosebank Dr 11C is currently not for sale and is not an active listing on Listing.ca.
NEARBY SCHOOLS
6 Rosebank Dr 11C is currently not for sale and is not an active listing on Listing.ca.
Alexander Stirling PS 15.1 km
70 Fawcett Trail, M1B3A9
Phone: (416) 396-6020 Berner Trail Jr PS 13.4 km
120 Berner Trail, M1B1B3
Phone: (416) 396-6050 Burrows Hall Jr PS 12.4 km
151 Burrows Hall Blvd, M1B1M5
Phone: (416) 396-6105 Emily Carr PS 14.5 km
90 John Tabor Trail, M1B2V2
Phone: (416) 396-6230 Grey Owl Jr PS 14.1 km
150 Wickson Trail, M1B1M4
Phone: (416) 396-6290 Lucy Maud Montgomery Jr & Sr PS 13.6 km
95 Murison Blvd, M1B2L6
Phone: (416) 396-6838 Malvern Jr PS 12.8 km
70 Mammoth Hall Trail, M1B1P6
Phone: (416) 396-6440 Mary Shadd PS 15.0 km
135 Hupfield Trail, M1B4R6
Phone: (416) 396-6450 Sacred Heart 14.7 km
75 Hupfield Trail, M1B4S3
Phone: (416) 393-5415 St Florence 13.6 km
101 Murison Blvd, M1B2L6
Phone: (416) 393-5385 St Gabriel Lalemant 14.7 km
160 Crow Trail, M1B1Y3
Phone: (416) 393-5377 Tom Longboat Jr PS 14.2 km
37 Crow Trail, M1B1X6
Phone: (416) 396-6610 Tom Longboat Jr PS 14.2 km
37 Crow Trail, M1B1X6
Phone: (416) 696-6610 Toronto District School Board 12.8 km
70 Mammoth Hall Trl, M1B1P6
Phone: (416) 396-3389 West Hill CI 12.3 km
350 Morningside Ave, M1E3G3
Phone: (416) 396-6864 YMCA 13.6 km
95 Murison Blvd, M1B2L6
Phone: (416) 287-7925
NEARBY PHARMACIES
70 Fawcett Trail, M1B3A9
Phone: (416) 396-6020 Berner Trail Jr PS 13.4 km
120 Berner Trail, M1B1B3
Phone: (416) 396-6050 Burrows Hall Jr PS 12.4 km
151 Burrows Hall Blvd, M1B1M5
Phone: (416) 396-6105 Emily Carr PS 14.5 km
90 John Tabor Trail, M1B2V2
Phone: (416) 396-6230 Grey Owl Jr PS 14.1 km
150 Wickson Trail, M1B1M4
Phone: (416) 396-6290 Lucy Maud Montgomery Jr & Sr PS 13.6 km
95 Murison Blvd, M1B2L6
Phone: (416) 396-6838 Malvern Jr PS 12.8 km
70 Mammoth Hall Trail, M1B1P6
Phone: (416) 396-6440 Mary Shadd PS 15.0 km
135 Hupfield Trail, M1B4R6
Phone: (416) 396-6450 Sacred Heart 14.7 km
75 Hupfield Trail, M1B4S3
Phone: (416) 393-5415 St Florence 13.6 km
101 Murison Blvd, M1B2L6
Phone: (416) 393-5385 St Gabriel Lalemant 14.7 km
160 Crow Trail, M1B1Y3
Phone: (416) 393-5377 Tom Longboat Jr PS 14.2 km
37 Crow Trail, M1B1X6
Phone: (416) 396-6610 Tom Longboat Jr PS 14.2 km
37 Crow Trail, M1B1X6
Phone: (416) 696-6610 Toronto District School Board 12.8 km
70 Mammoth Hall Trl, M1B1P6
Phone: (416) 396-3389 West Hill CI 12.3 km
350 Morningside Ave, M1E3G3
Phone: (416) 396-6864 YMCA 13.6 km
95 Murison Blvd, M1B2L6
Phone: (416) 287-7925
Shoppers Drug Mart 12.5 km
A-1780 Markham Rd, M1B2W2
Phone: (416) 239-4567
NEARBY RESTAURANTS AND CAFETERIAS
A-1780 Markham Rd, M1B2W2
Phone: (416) 239-4567
Wendy's 14.6 km
8111 Sheppard Ave E, M1B6A3
Phone: (416) 353-0120
NEARBY COFFEE SHOPS
8111 Sheppard Ave E, M1B6A3
Phone: (416) 353-0120
Dark City Coffee Company 14.4 km
410 McLevin Ave, M1B5J5
Phone: (416) 282-2307 Tim Hortons 14.6 km
8129 Sheppard Ave E, M1B6A3
Phone: (416) 286-0725
410 McLevin Ave, M1B5J5
Phone: (416) 282-2307 Tim Hortons 14.6 km
8129 Sheppard Ave E, M1B6A3
Phone: (416) 286-0725
Are You a Licensed Real Estate Agent or Broker?
© 2011-2025 Real Estate Bay Realty Inc, Brokerage
The information provided herein must only be used by consumers that have a bona fide interest in the purchase, sale, or lease of real estate and may not be used for any commercial or any other purpose. Information is deemed reliable but is not guaranteed accurate by TREB, Listing.ca or Real Estate Bay Realty, Brokerage.
The trademarks MLS®, Multiple Listing Service® and the associated logos are owned by The Canadian Real Estate Association (CREA) and identify the quality of services provided by real estate professionals who are members of CREA. Used under license.
Real Estate Bay Realty, Brokerage
220 Duncan Mill Road, Suite 209
Toronto, ON M3B 3J5
Phone: 416-800-1055
info@listing.ca Listing.ca on Twitter
RealEstateBay.ca on Facebook
220 Duncan Mill Road, Suite 209
Toronto, ON M3B 3J5
Phone: 416-800-1055
info@listing.ca Listing.ca on Twitter
RealEstateBay.ca on Facebook