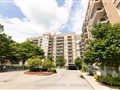
59 Neptune Dr 203
$442,856
Comparative Market Analysis
May 25, 2025
NOT AN ACTIVE LISTING
Historical Performance
| Period | $ Change | % Change |
| 1 Day | +$303 | +0.068% |
| 7 Days | +$222 | +0.050% |
| 30 Days | +$280 | +0.063% |
| 3 Months | -$792 | -0.179% |
| 6 Months | +$5,044 | +1.15% |
| 1 Year | -$21.9k | -4.71% |
| 3 Years | +$56.5k | +14.6% |
| 5 Years | +$118k | +36.4% |
| 10 Years | +$257k | +138% |
List My Property
Real Estate Statistics
Financing Solutions
AS SEEN ON


Are You a Licensed Real Estate Agent or Broker?