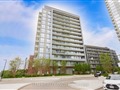
55 Ann O'reilly Rd 2911
$792,941
Comparative Market Analysis
Mar 10, 2025
NOT AN ACTIVE LISTING
Historical Performance
| Period | $ Change | % Change |
| 1 Day | +$556 | +0.070% |
| 7 Days | +$349 | +0.044% |
| 30 Days | +$370 | +0.047% |
| 3 Months | -$2,055 | -0.258% |
| 6 Months | +$7,471 | +0.951% |
| 1 Year | -$42.4k | -5.07% |
| 3 Years | +$123k | +18.3% |
| 5 Years | +$215k | +37.2% |
| 10 Years | +$452k | +133% |
List My Property
Real Estate Statistics
Financing Solutions
AS SEEN ON


Are You a Licensed Real Estate Agent or Broker?