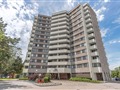
53 Neptune Dr 3
$591,307
Comparative Market Analysis
May 25, 2025
NOT AN ACTIVE LISTING
Historical Performance
| Period | $ Change | % Change |
| 1 Day | +$405 | +0.068% |
| 7 Days | +$282 | +0.048% |
| 30 Days | +$300 | +0.051% |
| 3 Months | -$1,299 | -0.219% |
| 6 Months | +$6,228 | +1.06% |
| 1 Year | -$30.4k | -4.89% |
| 3 Years | +$71.3k | +13.7% |
| 5 Years | +$150k | +34.1% |
| 10 Years | +$334k | +129% |
List My Property
Real Estate Statistics
Financing Solutions
AS SEEN ON


Are You a Licensed Real Estate Agent or Broker?