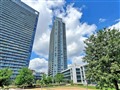
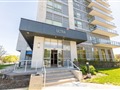
50 Ann O'reilly Rd 430
$505,675
Comparative Market Analysis
May 29, 2025
NOT AN ACTIVE LISTING
Historical Performance
| Period | $ Change | % Change |
| 1 Day | +$354 | +0.070% |
| 7 Days | +$219 | +0.043% |
| 30 Days | +$219 | +0.043% |
| 3 Months | -$1,370 | -0.270% |
| 6 Months | +$4,628 | +0.924% |
| 1 Year | -$27.4k | -5.14% |
| 3 Years | +$77.4k | +18.1% |
| 5 Years | +$136k | +36.9% |
| 10 Years | +$288k | +132% |
List My Property
Real Estate Statistics
Financing Solutions
Browsing History
812 Grandview Way, Toronto
1 second ago
814 Grandview Way, Toronto
1 second ago
509 Grandview Way, Toronto
1 second ago
117 Grandview Way, Toronto
2 seconds ago
207 Grandview Way, Toronto
2 seconds ago
AS SEEN ON


Are You a Licensed Real Estate Agent or Broker?