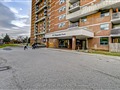
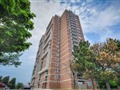
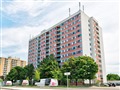
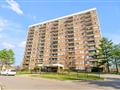
430 Mclevin Ave 511
$568,212
Comparative Market Analysis
May 16, 2025
NOT AN ACTIVE LISTING
Historical Performance
| Period | $ Change | % Change |
| 1 Day | +$372 | +0.065% |
| 7 Days | +$319 | +0.056% |
| 30 Days | +$386 | +0.068% |
| 3 Months | -$628 | -0.110% |
| 6 Months | +$7,679 | +1.37% |
| 1 Year | -$25.4k | -4.28% |
| 3 Years | +$105k | +22.8% |
| 5 Years | +$194k | +51.8% |
| 10 Years | +$347k | +157% |
List My Property
Real Estate Statistics
Financing Solutions
Browsing History
21 Carlton St 4201, Toronto
1 second ago
21 Carlton St 1801, Toronto
1 second ago
21 Carlton St 708, Toronto
1 second ago
77 Carlton St 904, Toronto
1 second ago
21 Carlton St 709, Toronto
2 seconds ago
AS SEEN ON

Are You a Licensed Real Estate Agent or Broker?