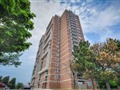
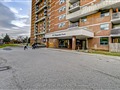
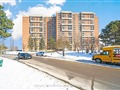
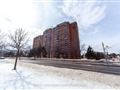
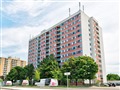
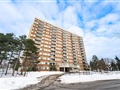
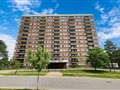
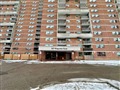
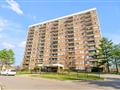
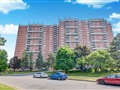
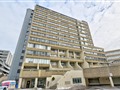
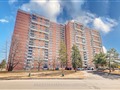
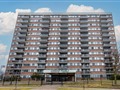
430 Mclevin Ave 1115
$672,903
Comparative Market Analysis
May 16, 2025
NOT AN ACTIVE LISTING
Historical Performance
| Period | $ Change | % Change |
| 1 Day | +$440 | +0.065% |
| 7 Days | +$315 | +0.047% |
| 30 Days | +$148 | +0.022% |
| 3 Months | -$1,771 | -0.263% |
| 6 Months | +$6,893 | +1.03% |
| 1 Year | -$35.4k | -5.00% |
| 3 Years | +$106k | +18.6% |
| 5 Years | +$199k | +42.0% |
| 10 Years | +$391k | +138% |
List My Property
Real Estate Statistics
Financing Solutions
Browsing History
169 Jones Ave 3, Toronto
1 second ago
33 Bay St 2901, Toronto
2 seconds ago
33 Bay St 305, Toronto
3 seconds ago
70 Rosehill Ave 307, Toronto
4 seconds ago
67 Condor Ave Basement, Toronto
4 seconds ago
AS SEEN ON

Are You a Licensed Real Estate Agent or Broker?