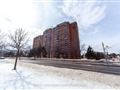
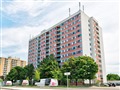
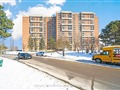
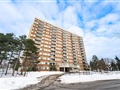
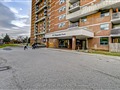
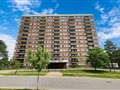
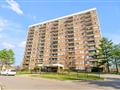
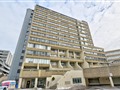
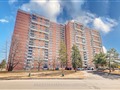
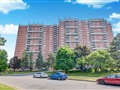
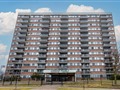
430 Mclevin Ave 1003
$526,192
Comparative Market Analysis
May 16, 2025
NOT AN ACTIVE LISTING
Historical Performance
| Period | $ Change | % Change |
| 1 Day | +$344 | +0.065% |
| 7 Days | +$248 | +0.047% |
| 30 Days | +$126 | +0.024% |
| 3 Months | -$1,349 | -0.256% |
| 6 Months | +$5,465 | +1.05% |
| 1 Year | -$27.5k | -4.97% |
| 3 Years | +$83.2k | +18.8% |
| 5 Years | +$157k | +42.4% |
| 10 Years | +$307k | +140% |
List My Property
Real Estate Statistics
Financing Solutions
Browsing History
51 Peace Dr, Toronto
1 second ago
2721 Victoria Park Ave 1004, Toronto
1 second ago
2721 Victoria Park Ave 1504, Toronto
2 seconds ago
35 Bales Ave 1106, Toronto
2 seconds ago
26 Olive Ave 1705, Toronto
3 seconds ago
6 Peace Dr, Toronto
3 seconds ago
40 Rosehill Ave 504, Toronto
3 seconds ago
AS SEEN ON

Are You a Licensed Real Estate Agent or Broker?