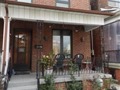
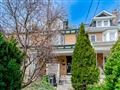
43 Wyndham St
$1,107,357
Comparative Market Analysis
Jul 6, 2025
NOT AN ACTIVE LISTING
Historical Performance
| Period | $ Change | % Change |
| 1 Day | +$638 | +0.058% |
| 7 Days | +$1,803 | +0.163% |
| 30 Days | -$1,381 | -0.125% |
| 3 Months | -$4,972 | -0.447% |
| 6 Months | +$16.2k | +1.48% |
| 1 Year | -$50.5k | -4.36% |
| 3 Years | +$121k | +12.3% |
| 5 Years | +$263k | +31.1% |
| 10 Years | +$613k | +124% |
List My Property
Real Estate Statistics
Financing Solutions
AS SEEN ON


Are You a Licensed Real Estate Agent or Broker?