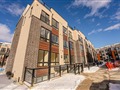
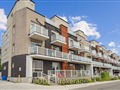
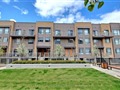
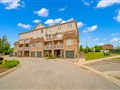
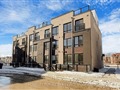
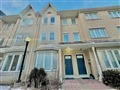
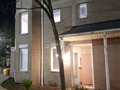
42 Pinery Tr 33
$612,813
Comparative Market Analysis
Jul 7, 2025
NOT AN ACTIVE LISTING
Historical Performance
| Period | $ Change | % Change |
| 1 Day | +$225 | +0.037% |
| 7 Days | +$500 | +0.082% |
| 30 Days | -$100 | -0.016% |
| 3 Months | -$512 | -0.084% |
| 6 Months | +$9,044 | +1.50% |
| 1 Year | -$28.5k | -4.44% |
| 3 Years | +$91.8k | +17.6% |
| 5 Years | +$171k | +38.6% |
| 10 Years | +$352k | +135% |
List My Property
Real Estate Statistics
Financing Solutions
Browsing History
580 Deloraine Ave, Toronto
5 seconds ago
275 Waverley Rd, Toronto
10 seconds ago
22 East Haven Dr 631, Toronto
15 seconds ago
88 Harbour St 7105, Toronto
20 seconds ago
104 Waverley Rd, Toronto
25 seconds ago
29 Elise Terr, Toronto
30 seconds ago
130 Strathearn Rd, Toronto
35 seconds ago
284 Bloor St 308, Toronto
40 seconds ago
37 Florida Cres, Toronto
45 seconds ago
88 Harbour St 3908, Toronto
50 seconds ago
AS SEEN ON


Are You a Licensed Real Estate Agent or Broker?