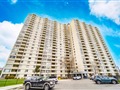
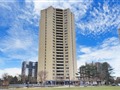
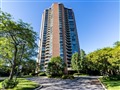
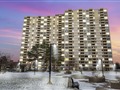
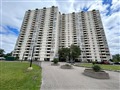
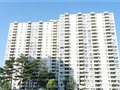
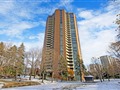
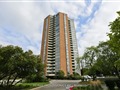
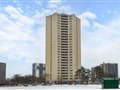
390 Dixon Rd 2111
$533,053
Comparative Market Analysis
May 3, 2025
NOT AN ACTIVE LISTING
Historical Performance
| Period | $ Change | % Change |
| 1 Day | +$330 | +0.062% |
| 7 Days | +$249 | +0.047% |
| 30 Days | -$34 | -0.006% |
| 3 Months | -$1,584 | -0.296% |
| 6 Months | +$5,465 | +1.04% |
| 1 Year | -$28.4k | -5.07% |
| 3 Years | +$74.8k | +16.3% |
| 5 Years | +$150k | +39.3% |
| 10 Years | +$310k | +139% |
List My Property
Real Estate Statistics
Financing Solutions
AS SEEN ON


Are You a Licensed Real Estate Agent or Broker?