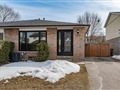
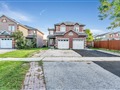
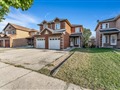
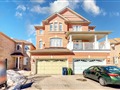
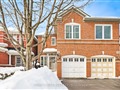
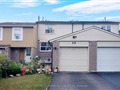
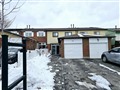
35 Lowry Sq
$954,796
Comparative Market Analysis
Jun 30, 2025
NOT AN ACTIVE LISTING
Historical Performance
| Period | $ Change | % Change |
| 1 Day | +$518 | +0.054% |
| 7 Days | +$1,300 | +0.136% |
| 30 Days | -$1,382 | -0.145% |
| 3 Months | -$4,703 | -0.490% |
| 6 Months | +$12.4k | +1.32% |
| 1 Year | -$47.4k | -4.73% |
| 3 Years | +$149k | +18.5% |
| 5 Years | +$266k | +38.7% |
| 10 Years | +$550k | +136% |
List My Property
Real Estate Statistics
Financing Solutions
Browsing History
84 Branstone Rd, Toronto
1 second ago
1001 Midland Ave, Toronto
2 seconds ago
170 Parkhurst Blvd, Toronto
3 seconds ago
364 Melita Ave, Toronto
4 seconds ago
502 King St E, Toronto
5 seconds ago
536 Midland Ave, Toronto
6 seconds ago
44 Park Blvd, Toronto
7 seconds ago
44 St Clarens Ave, Toronto
8 seconds ago
178 Edmonton Dr, Toronto
9 seconds ago
150 Brickworks Lane, Toronto
10 seconds ago
AS SEEN ON


Are You a Licensed Real Estate Agent or Broker?