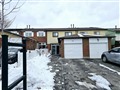
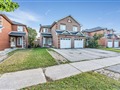
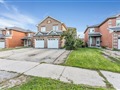
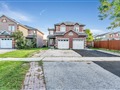
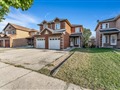
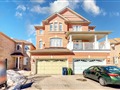
31 Lowry Sq
$910,875
Comparative Market Analysis
Jul 1, 2025
NOT AN ACTIVE LISTING
Historical Performance
| Period | $ Change | % Change |
| 1 Day | +$494 | +0.054% |
| 7 Days | +$1,327 | +0.146% |
| 30 Days | -$888 | -0.097% |
| 3 Months | -$3,032 | -0.332% |
| 6 Months | +$15.0k | +1.68% |
| 1 Year | -$37.2k | -3.92% |
| 3 Years | +$171k | +23.2% |
| 5 Years | +$294k | +47.7% |
| 10 Years | +$582k | +177% |
List My Property
Real Estate Statistics
Financing Solutions
Browsing History
23 Coules Crt, Toronto
6 seconds ago
1114 St Clarens Ave, Toronto
11 seconds ago
36 Farnsworth Dr, Toronto
17 seconds ago
289 Arlington Ave, Toronto
22 seconds ago
14 Ashfield Dr, Toronto
25 seconds ago
AS SEEN ON


Are You a Licensed Real Estate Agent or Broker?