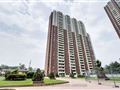
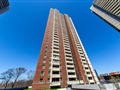
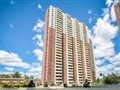
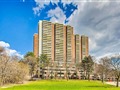
3 Massey Sq 3504
$517,073
Comparative Market Analysis
May 4, 2024
NOT AN ACTIVE LISTING
Historical Performance
| Period | $ Change | % Change |
| 1 Day | +$330 | +0.064% |
| 7 Days | +$238 | +0.046% |
| 30 Days | +$32 | +0.006% |
| 3 Months | -$1,494 | -0.288% |
| 6 Months | +$5,184 | +1.01% |
| 1 Year | -$27.6k | -5.08% |
| 3 Years | +$67.4k | +15.0% |
| 5 Years | +$136k | +35.5% |
| 10 Years | +$294k | +132% |
List My Property
Real Estate Statistics
Financing Solutions
AS SEEN ON


Are You a Licensed Real Estate Agent or Broker?