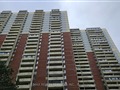
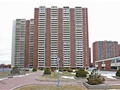
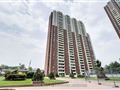
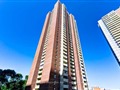
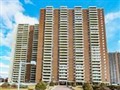
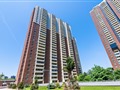
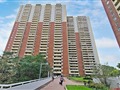
3 Massey Sq 2005
$463,043
Comparative Market Analysis
Jun 5, 2025
NOT AN ACTIVE LISTING
Historical Performance
| Period | $ Change | % Change |
| 1 Day | +$296 | +0.064% |
| 7 Days | +$281 | +0.061% |
| 30 Days | +$361 | +0.078% |
| 3 Months | -$244 | -0.053% |
| 6 Months | +$6,955 | +1.52% |
| 1 Year | -$19.3k | -3.99% |
| 3 Years | +$80.0k | +20.9% |
| 5 Years | +$154k | +49.8% |
| 10 Years | +$293k | +172% |
List My Property
Real Estate Statistics
Financing Solutions
Browsing History
213 Grace St, Toronto
1 second ago
14 Willie Crt, Toronto
1 second ago
19 Buttonwood Ave, Toronto
2 seconds ago
18 Willie Crt, Toronto
3 seconds ago
2 Mahoney Ave, Toronto
4 seconds ago
18 Boyce Ave, Toronto
4 seconds ago
21 Gort Ave, Toronto
4 seconds ago
26 Timbercreek Crt, Toronto
4 seconds ago
2428 Bloor St 2nd, Toronto
4 seconds ago
87 Kendleton Dr, Toronto
5 seconds ago
AS SEEN ON


Are You a Licensed Real Estate Agent or Broker?