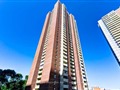
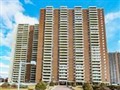
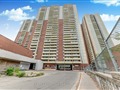
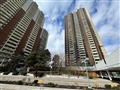
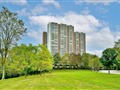
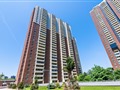
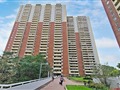
3 Massey Sq 2004
$497,164
Comparative Market Analysis
Mar 12, 2025
NOT AN ACTIVE LISTING
Historical Performance
| Period | $ Change | % Change |
| 1 Day | +$317 | +0.064% |
| 7 Days | +$340 | +0.068% |
| 30 Days | +$574 | +0.116% |
| 3 Months | +$338 | +0.068% |
| 6 Months | +$8,705 | +1.78% |
| 1 Year | -$17.9k | -3.47% |
| 3 Years | +$95.1k | +23.7% |
| 5 Years | +$182k | +57.7% |
| 10 Years | +$329k | +196% |
List My Property
Real Estate Statistics
Financing Solutions
AS SEEN ON


Are You a Licensed Real Estate Agent or Broker?