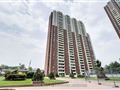
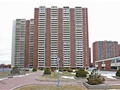
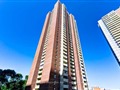
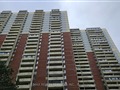
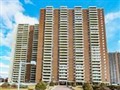
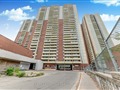
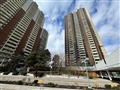
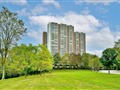
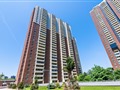
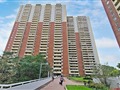
3 Massey Sq 1803
$488,622
Comparative Market Analysis
Jun 5, 2025
NOT AN ACTIVE LISTING
Historical Performance
| Period | $ Change | % Change |
| 1 Day | +$312 | +0.064% |
| 7 Days | +$271 | +0.055% |
| 30 Days | +$255 | +0.052% |
| 3 Months | -$672 | -0.137% |
| 6 Months | +$6,461 | +1.34% |
| 1 Year | -$22.4k | -4.39% |
| 3 Years | +$76.9k | +18.7% |
| 5 Years | +$150k | +44.3% |
| 10 Years | +$296k | +154% |
List My Property
Real Estate Statistics
Financing Solutions
Browsing History
238 Simcoe St 705, Toronto
1 second ago
26 Henry Welsh Dr, Toronto
1 second ago
13 Westhead Rd, Toronto
1 second ago
42 Broadbent Ave, Toronto
2 seconds ago
101 Roehampton Ave 1411, Toronto
2 seconds ago
21 Jodphur Ave, Toronto
2 seconds ago
22 Henry Welsh Dr, Toronto
2 seconds ago
54 Kendleton Dr, Toronto
2 seconds ago
George Anderson Dr, Toronto
2 seconds ago
640 Runnymede Rd BSMT, Toronto
3 seconds ago
AS SEEN ON


Are You a Licensed Real Estate Agent or Broker?