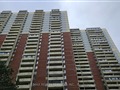
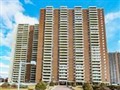
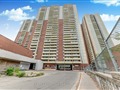
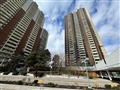
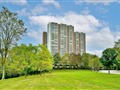
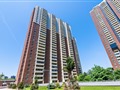
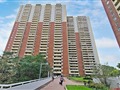
3 Massey Sq 1003
$448,579
Comparative Market Analysis
Jun 5, 2025
NOT AN ACTIVE LISTING
Historical Performance
| Period | $ Change | % Change |
| 1 Day | +$286 | +0.064% |
| 7 Days | +$250 | +0.056% |
| 30 Days | +$239 | +0.053% |
| 3 Months | -$612 | -0.136% |
| 6 Months | +$5,909 | +1.33% |
| 1 Year | -$20.8k | -4.42% |
| 3 Years | +$68.9k | +18.2% |
| 5 Years | +$136k | +43.3% |
| 10 Years | +$279k | +165% |
List My Property
Real Estate Statistics
Financing Solutions
Browsing History
29 Willie Crt, Toronto
1 second ago
20 Grace St, Toronto
1 second ago
21 Grace St, Toronto
1 second ago
185 Roehampton Ave 2207, Toronto
1 second ago
3 Massey Sq 3502, Toronto
2 seconds ago
15 English Garden Way, Toronto
2 seconds ago
33 Maitland St 204, Toronto
2 seconds ago
AS SEEN ON


Are You a Licensed Real Estate Agent or Broker?