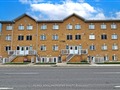
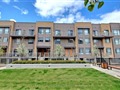
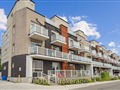
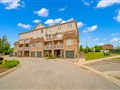
28 Rosebank Dr 1111
$1,110,026
Comparative Market Analysis
May 9, 2025
NOT AN ACTIVE LISTING
Historical Performance
| Period | $ Change | % Change |
| 1 Day | +$407 | +0.037% |
| 7 Days | +$934 | +0.084% |
| 30 Days | -$48 | -0.004% |
| 3 Months | -$502 | -0.045% |
| 6 Months | +$17.2k | +1.58% |
| 1 Year | -$49.7k | -4.29% |
| 3 Years | +$172k | +18.3% |
| 5 Years | +$318k | +40.1% |
| 10 Years | +$650k | +141% |
List My Property
Real Estate Statistics
Financing Solutions
Browsing History
29 Rosebank Dr 119, Toronto
2 seconds ago
30 Fashion Roseway, Toronto
3 seconds ago
Wessex Pl, Toronto
3 seconds ago
AS SEEN ON


Are You a Licensed Real Estate Agent or Broker?