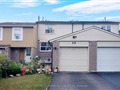
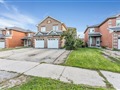
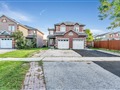
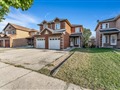
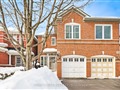
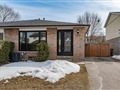
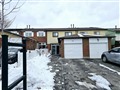
27 Lowry Sq
$994,454
Comparative Market Analysis
Jul 1, 2025
NOT AN ACTIVE LISTING
Historical Performance
| Period | $ Change | % Change |
| 1 Day | +$540 | +0.054% |
| 7 Days | +$1,442 | +0.145% |
| 30 Days | -$1,009 | -0.101% |
| 3 Months | -$3,517 | -0.352% |
| 6 Months | +$15.7k | +1.61% |
| 1 Year | -$43.1k | -4.16% |
| 3 Years | +$173k | +21.1% |
| 5 Years | +$308k | +45.0% |
| 10 Years | +$621k | +166% |
List My Property
Real Estate Statistics
Financing Solutions
Browsing History
330 Richmond St 2617, Toronto
6 seconds ago
8 seconds ago
AS SEEN ON


Are You a Licensed Real Estate Agent or Broker?