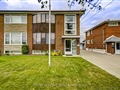
26 Gotham Crt
$1,020,969
Comparative Market Analysis
Jul 3, 2025
NOT AN ACTIVE LISTING
Historical Performance
| Period | $ Change | % Change |
| 1 Day | +$563 | +0.055% |
| 7 Days | +$1,431 | +0.140% |
| 30 Days | -$1,571 | -0.154% |
| 3 Months | -$5,383 | -0.525% |
| 6 Months | +$12.7k | +1.26% |
| 1 Year | -$51.8k | -4.83% |
| 3 Years | +$129k | +14.5% |
| 5 Years | +$277k | +37.2% |
| 10 Years | +$573k | +128% |
List My Property
Real Estate Statistics
Financing Solutions
Browsing History
Wickham Crt, Toronto
1 second ago
AS SEEN ON


Are You a Licensed Real Estate Agent or Broker?