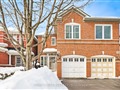
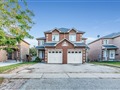
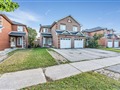
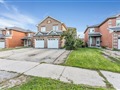
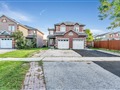
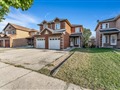
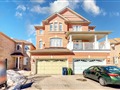
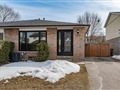
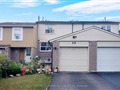
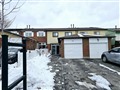
23 Robbinstone Dr
$874,327
Comparative Market Analysis
Jul 4, 2025
NOT AN ACTIVE LISTING
Historical Performance
| Period | $ Change | % Change |
| 1 Day | +$475 | +0.054% |
| 7 Days | +$1,356 | +0.155% |
| 30 Days | -$438 | -0.050% |
| 3 Months | -$1,467 | -0.168% |
| 6 Months | +$17.7k | +2.06% |
| 1 Year | -$27.0k | -3.00% |
| 3 Years | +$193k | +28.3% |
| 5 Years | +$299k | +52.1% |
| 10 Years | +$514k | +143% |
List My Property
Real Estate Statistics
Financing Solutions
Browsing History
42 King Edward Ave, Toronto
1 second ago
AS SEEN ON


Are You a Licensed Real Estate Agent or Broker?