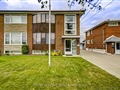
16 Gotham Crt
$1,194,714
Comparative Market Analysis
Jun 22, 2025
NOT AN ACTIVE LISTING
Historical Performance
| Period | $ Change | % Change |
| 1 Day | +$659 | +0.055% |
| 7 Days | +$1,810 | +0.152% |
| 30 Days | -$1,174 | -0.098% |
| 3 Months | -$4,134 | -0.345% |
| 6 Months | +$19.4k | +1.65% |
| 1 Year | -$50.1k | -4.03% |
| 3 Years | +$179k | +17.7% |
| 5 Years | +$365k | +44.0% |
| 10 Years | +$702k | +143% |
List My Property
Real Estate Statistics
Financing Solutions
Browsing History
20 Fairholme Ave, Toronto
1 second ago
6 Eva Rd, Toronto
1 second ago
104 Maybourne Ave, Toronto
1 second ago
206 The West Mall, Toronto
2 seconds ago
882 Weston Rd, Toronto
2 seconds ago
Loney Ave, Toronto
3 seconds ago
AS SEEN ON


Are You a Licensed Real Estate Agent or Broker?