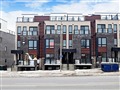
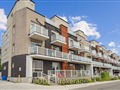
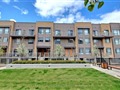
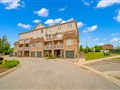
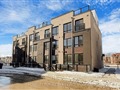
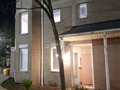
1365 Neilson Dr 20
$614,458
Comparative Market Analysis
Jun 14, 2025
NOT AN ACTIVE LISTING
Historical Performance
| Period | $ Change | % Change |
| 1 Day | +$225 | +0.037% |
| 7 Days | +$500 | +0.081% |
| 30 Days | -$106 | -0.017% |
| 3 Months | -$533 | -0.087% |
| 6 Months | +$9,028 | +1.49% |
| 1 Year | -$28.7k | -4.46% |
| 3 Years | +$91.8k | +17.6% |
| 5 Years | +$171k | +38.5% |
| 10 Years | +$352k | +134% |
List My Property
Real Estate Statistics
Financing Solutions
AS SEEN ON


Are You a Licensed Real Estate Agent or Broker?