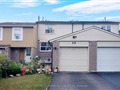
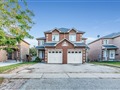
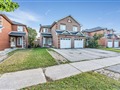
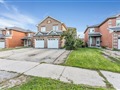
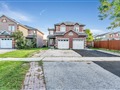
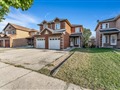
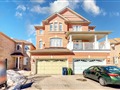
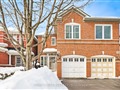
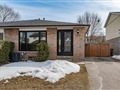
129 Lowry Sq
$961,505
Comparative Market Analysis
Jul 1, 2025
NOT AN ACTIVE LISTING
Historical Performance
| Period | $ Change | % Change |
| 1 Day | +$522 | +0.054% |
| 7 Days | +$1,441 | +0.150% |
| 30 Days | -$749 | -0.078% |
| 3 Months | -$2,672 | -0.277% |
| 6 Months | +$16.7k | +1.77% |
| 1 Year | -$38.4k | -3.84% |
| 3 Years | +$178k | +22.7% |
| 5 Years | +$315k | +48.8% |
| 10 Years | +$626k | +187% |
List My Property
Real Estate Statistics
Financing Solutions
Browsing History
97 Durant Ave, Toronto
6 seconds ago
19 Via Italia, Toronto
11 seconds ago
191 St Clarens Ave, Toronto
16 seconds ago
1132 Brimley Rd, Toronto
21 seconds ago
1 Radwinter Dr, Toronto
21 seconds ago
AS SEEN ON


Are You a Licensed Real Estate Agent or Broker?