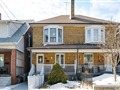
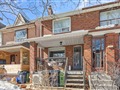
116 Morrison Ave
$910,529
Comparative Market Analysis
May 22, 2025
NOT AN ACTIVE LISTING
Historical Performance
| Period | $ Change | % Change |
| 1 Day | +$510 | +0.056% |
| 7 Days | +$1,361 | +0.150% |
| 30 Days | -$1,230 | -0.135% |
| 3 Months | -$4,233 | -0.463% |
| 6 Months | +$12.9k | +1.44% |
| 1 Year | -$41.9k | -4.40% |
| 3 Years | +$106k | +13.1% |
| 5 Years | +$222k | +32.2% |
| 10 Years | +$494k | +119% |
List My Property
Real Estate Statistics
Financing Solutions
Browsing History
35 Raglan Ave 201, Toronto
1 second ago
268 Earlscourt Ave, Toronto
2 seconds ago
16 Woodcroft Cres, Toronto
2 seconds ago
49 Corby Ave, Toronto
2 seconds ago
43 Norman Ave, Toronto
2 seconds ago
19 Holmesdale Cres, Toronto
3 seconds ago
18 Earlscourt Ave, Toronto
3 seconds ago
AS SEEN ON


Are You a Licensed Real Estate Agent or Broker?