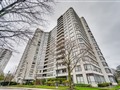
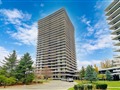
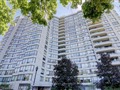
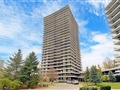
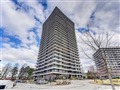
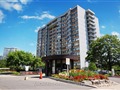
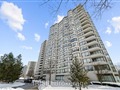
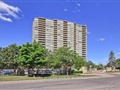
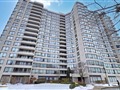
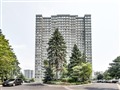
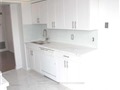
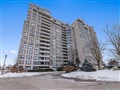
115 Antibes Dr 204
$612,986
Comparative Market Analysis
Jun 8, 2025
NOT AN ACTIVE LISTING
Historical Performance
| Period | $ Change | % Change |
| 1 Day | +$413 | +0.067% |
| 7 Days | +$311 | +0.051% |
| 30 Days | +$358 | +0.058% |
| 3 Months | -$1,060 | -0.173% |
| 6 Months | +$7,272 | +1.20% |
| 1 Year | -$29.4k | -4.57% |
| 3 Years | +$96.2k | +18.6% |
| 5 Years | +$163k | +36.3% |
| 10 Years | +$334k | +120% |
List My Property
Real Estate Statistics
Financing Solutions
Browsing History
24 Kingland Cres, Toronto
2 seconds ago
1023 Warden Ave, Toronto
3 seconds ago
16 Winnett Ave, Toronto
4 seconds ago
5 Mariner Terr 3303, Toronto
5 seconds ago
1881 Mcnicoll Ave 616, Toronto
6 seconds ago
1883 Mcnicoll Ave 1005, Toronto
7 seconds ago
22 Finchley Rd, Toronto
8 seconds ago
28 Stadium Rd 125, Toronto
9 seconds ago
124 Wimbledon Rd, Toronto
10 seconds ago
244 Gilmour Ave, Toronto
11 seconds ago
AS SEEN ON


Are You a Licensed Real Estate Agent or Broker?