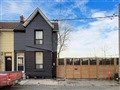
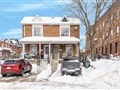
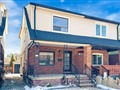
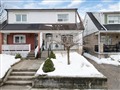
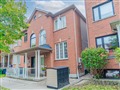
11 Talbot St
$1,036,643
Comparative Market Analysis
Apr 18, 2025
NOT AN ACTIVE LISTING
Historical Performance
| Period | $ Change | % Change |
| 1 Day | +$577 | +0.056% |
| 7 Days | +$1,531 | +0.148% |
| 30 Days | -$1,373 | -0.132% |
| 3 Months | -$4,783 | -0.459% |
| 6 Months | +$14.4k | +1.41% |
| 1 Year | -$49.2k | -4.53% |
| 3 Years | +$149k | +16.8% |
| 5 Years | +$289k | +38.7% |
| 10 Years | +$598k | +137% |
List My Property
Real Estate Statistics
Financing Solutions
Browsing History
26 Talbot St, Toronto
2 seconds ago
6 Burrard Rd, Toronto
3 seconds ago
25 Talbot St, Toronto
4 seconds ago
1 Burrard Rd, Toronto
5 seconds ago
40 Talbot St, Toronto
6 seconds ago
18 Pryor Ave, Toronto
7 seconds ago
27 Pryor Ave, Toronto
8 seconds ago
16 Talbot St, Toronto
15 seconds ago
8 Adrian Ave, Toronto
16 seconds ago
20 Pryor Ave, Toronto
17 seconds ago
AS SEEN ON


Are You a Licensed Real Estate Agent or Broker?