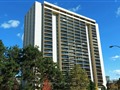
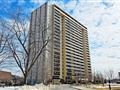
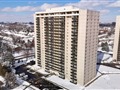
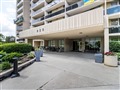
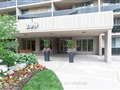
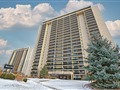
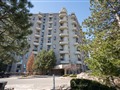
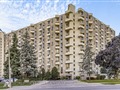
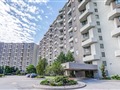
11 Neilson Dr 602
$571,892
Comparative Market Analysis
May 21, 2025
NOT AN ACTIVE LISTING
Historical Performance
| Period | $ Change | % Change |
| 1 Day | +$387 | +0.068% |
| 7 Days | +$254 | +0.044% |
| 30 Days | +$162 | +0.028% |
| 3 Months | -$1,595 | -0.278% |
| 6 Months | +$5,425 | +0.958% |
| 1 Year | -$30.8k | -5.12% |
| 3 Years | +$53.6k | +10.3% |
| 5 Years | +$136k | +31.1% |
| 10 Years | +$343k | +150% |
List My Property
Real Estate Statistics
Financing Solutions
AS SEEN ON


Are You a Licensed Real Estate Agent or Broker?