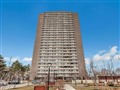
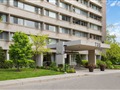
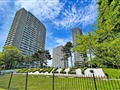
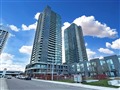
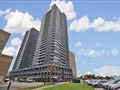
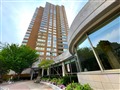
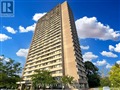
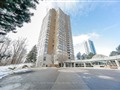
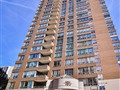
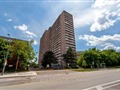
100 Leeward Glenway 2212
$339,320
Comparative Market Analysis
Apr 8, 2025
NOT AN ACTIVE LISTING
Historical Performance
| Period | $ Change | % Change |
| 1 Day | +$222 | +0.065% |
| 7 Days | +$191 | +0.056% |
| 30 Days | +$230 | +0.068% |
| 3 Months | -$390 | -0.115% |
| 6 Months | +$4,512 | +1.35% |
| 1 Year | -$15.5k | -4.38% |
| 3 Years | +$55.0k | +19.3% |
| 5 Years | +$105k | +44.7% |
| 10 Years | +$213k | +168% |
List My Property
Real Estate Statistics
Financing Solutions
Browsing History
100 Leeward Glenway 1701, Toronto
2 seconds ago
100 Leeward Glenway 2011, Toronto
3 seconds ago
100 Leeward Glenway 2005, Toronto
4 seconds ago
100 Leeward Glenway 2003, Toronto
5 seconds ago
100 Leeward Glenway 1605, Toronto
6 seconds ago
100 Leeward Glenway 1105, Toronto
7 seconds ago
100 Leeward Glenway 1805, Toronto
8 seconds ago
100 Leeward Glenway PH07, Toronto
9 seconds ago
100 Leeward Glenway 2112, Toronto
10 seconds ago
100 Leeward Glenway 1506, Toronto
11 seconds ago
AS SEEN ON


Are You a Licensed Real Estate Agent or Broker?