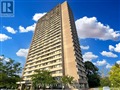
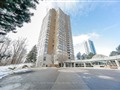
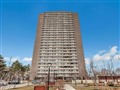
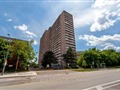
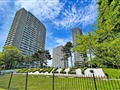
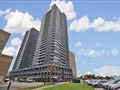
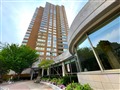
100 Leeward Glenway 2211
$474,147
Comparative Market Analysis
Apr 8, 2025
NOT AN ACTIVE LISTING
Historical Performance
| Period | $ Change | % Change |
| 1 Day | +$310 | +0.065% |
| 7 Days | +$259 | +0.055% |
| 30 Days | +$285 | +0.060% |
| 3 Months | -$657 | -0.138% |
| 6 Months | +$6,086 | +1.30% |
| 1 Year | -$22.2k | -4.47% |
| 3 Years | +$75.9k | +19.1% |
| 5 Years | +$145k | +44.1% |
| 10 Years | +$293k | +162% |
List My Property
Real Estate Statistics
Financing Solutions
Browsing History
100 Leeward Glenway 1102, Toronto
2 seconds ago
100 Leeward Glenway 2002, Toronto
3 seconds ago
30 Grandravine Dr UNIT 1, Toronto
4 seconds ago
65 East Liberty St TH71A, Toronto
6 seconds ago
1 Strawflower Mews LOT22, Toronto
7 seconds ago
65 East Liberty St TH69B, Toronto
8 seconds ago
65 East Liberty St TH114, Toronto
9 seconds ago
75 Mintwood Dr, Toronto
10 seconds ago
21 Grand Magazine St 201, Toronto
11 seconds ago
21 Grand Magazine St 203, Toronto
12 seconds ago
AS SEEN ON


Are You a Licensed Real Estate Agent or Broker?