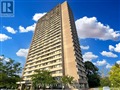
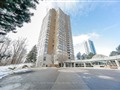
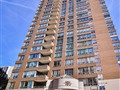
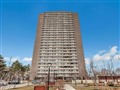
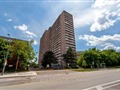
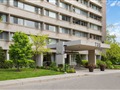
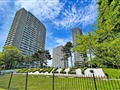
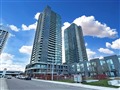
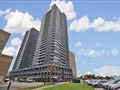
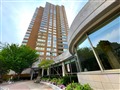
100 Leeward Glenway 2011
$392,743
Comparative Market Analysis
Apr 8, 2025
NOT AN ACTIVE LISTING
Historical Performance
| Period | $ Change | % Change |
| 1 Day | +$257 | +0.065% |
| 7 Days | +$239 | +0.061% |
| 30 Days | +$355 | +0.091% |
| 3 Months | -$157 | -0.040% |
| 6 Months | +$5,846 | +1.51% |
| 1 Year | -$16.5k | -4.03% |
| 3 Years | +$69.1k | +21.4% |
| 5 Years | +$131k | +50.1% |
| 10 Years | +$256k | +188% |
List My Property
Real Estate Statistics
Financing Solutions
Browsing History
100 Leeward Glenway 2005, Toronto
2 seconds ago
100 Leeward Glenway 2003, Toronto
3 seconds ago
100 Leeward Glenway 1605, Toronto
4 seconds ago
100 Leeward Glenway 1105, Toronto
5 seconds ago
100 Leeward Glenway 1805, Toronto
6 seconds ago
100 Leeward Glenway PH07, Toronto
7 seconds ago
100 Leeward Glenway 2112, Toronto
8 seconds ago
100 Leeward Glenway 1506, Toronto
9 seconds ago
100 Leeward Glenway 1912, Toronto
10 seconds ago
100 Leeward Glenway 1405, Toronto
11 seconds ago
AS SEEN ON


Are You a Licensed Real Estate Agent or Broker?