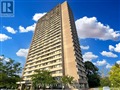
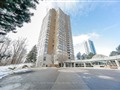
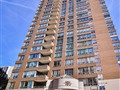
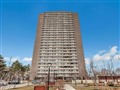
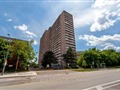
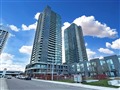
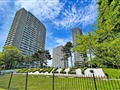
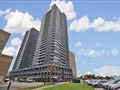
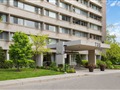
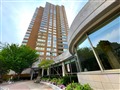
100 Leeward Glenway 1711
$495,451
Comparative Market Analysis
Apr 8, 2025
NOT AN ACTIVE LISTING
Historical Performance
| Period | $ Change | % Change |
| 1 Day | +$324 | +0.065% |
| 7 Days | +$225 | +0.045% |
| 30 Days | +$72 | +0.014% |
| 3 Months | -$1,418 | -0.285% |
| 6 Months | +$4,851 | +0.989% |
| 1 Year | -$26.6k | -5.10% |
| 3 Years | +$68.4k | +16.0% |
| 5 Years | +$133k | +36.7% |
| 10 Years | +$280k | +130% |
List My Property
Real Estate Statistics
Financing Solutions
Browsing History
100 Leeward Glenway 1705, Toronto
1 second ago
100 Leeward Glenway 1708, Toronto
2 seconds ago
100 Leeward Glenway 1606, Toronto
3 seconds ago
100 Leeward Glenway 2012, Toronto
4 seconds ago
100 Leeward Glenway 1602, Toronto
5 seconds ago
100 Leeward Glenway 1008, Toronto
6 seconds ago
100 Leeward Glenway 1407, Toronto
7 seconds ago
100 Leeward Glenway 1909, Toronto
8 seconds ago
100 Leeward Glenway 1604, Toronto
9 seconds ago
AS SEEN ON


Are You a Licensed Real Estate Agent or Broker?