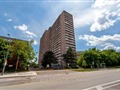
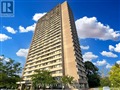
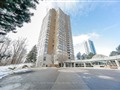
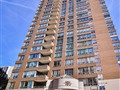
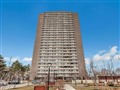
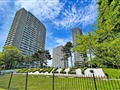
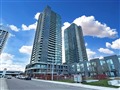
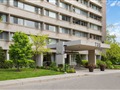
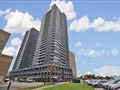
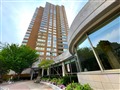
100 Leeward Glenway 1603
$476,034
Comparative Market Analysis
Apr 8, 2025
NOT AN ACTIVE LISTING
Historical Performance
| Period | $ Change | % Change |
| 1 Day | +$311 | +0.065% |
| 7 Days | +$264 | +0.055% |
| 30 Days | +$304 | +0.064% |
| 3 Months | -$594 | -0.125% |
| 6 Months | +$6,268 | +1.33% |
| 1 Year | -$21.8k | -4.38% |
| 3 Years | +$78.5k | +19.8% |
| 5 Years | +$150k | +45.8% |
| 10 Years | +$292k | +159% |
List My Property
Real Estate Statistics
Financing Solutions
Browsing History
100 Leeward Glenway 1712, Toronto
1 second ago
100 Leeward Glenway 2006, Toronto
2 seconds ago
100 Leeward Glenway #1903, Toronto
3 seconds ago
100 Leeward Glenway 1812, Toronto
4 seconds ago
100 Leeward Glenway 2103, Toronto
5 seconds ago
100 Leeward Glenway 1802, Toronto
6 seconds ago
100 Leeward Glenway 1006, Toronto
7 seconds ago
100 Leeward Glenway 1007, Toronto
8 seconds ago
100 Leeward Glenway 1502, Toronto
9 seconds ago
100 Leeward Glenway 1711, Toronto
10 seconds ago
AS SEEN ON


Are You a Licensed Real Estate Agent or Broker?