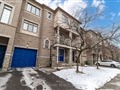
100 Bridgeport Dr
$1,118,293
Comparative Market Analysis
Jun 11, 2025
NOT AN ACTIVE LISTING
Historical Performance
| Period | $ Change | % Change |
| 1 Day | +$617 | +0.055% |
| 7 Days | +$1,624 | +0.145% |
| 30 Days | -$1,472 | -0.131% |
| 3 Months | -$5,101 | -0.454% |
| 6 Months | +$15.6k | +1.41% |
| 1 Year | -$53.0k | -4.52% |
| 3 Years | +$180k | +19.2% |
| 5 Years | +$314k | +39.0% |
| 10 Years | +$620k | +124% |
List My Property
Real Estate Statistics
Financing Solutions
Browsing History
31 Pelmo Cres, Toronto
1 second ago
Linden Ave, Toronto
1 second ago
209 Reiner Rd, Toronto
1 second ago
30 Mccord Rd, Toronto
1 second ago
129 Calvington Dr, Toronto
2 seconds ago
39 Neames Cres, Toronto
2 seconds ago
AS SEEN ON

Are You a Licensed Real Estate Agent or Broker?