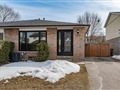
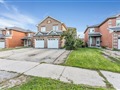
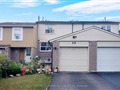
1 Lowry Sq
$888,584
Comparative Market Analysis
Jul 1, 2025
NOT AN ACTIVE LISTING
Historical Performance
| Period | $ Change | % Change |
| 1 Day | +$482 | +0.054% |
| 7 Days | +$1,245 | +0.140% |
| 30 Days | -$1,116 | -0.125% |
| 3 Months | -$3,824 | -0.429% |
| 6 Months | +$12.7k | +1.45% |
| 1 Year | -$41.5k | -4.46% |
| 3 Years | +$147k | +19.8% |
| 5 Years | +$263k | +42.0% |
| 10 Years | +$532k | +149% |
List My Property
Real Estate Statistics
Financing Solutions
Browsing History
624 Woodbine Ave, Toronto
1 second ago
39 Carus Ave, Toronto
2 seconds ago
2 Ennismore Pl, Toronto
3 seconds ago
34 Stonemanse Crt, Toronto
4 seconds ago
69 Branstone Rd, Toronto
4 seconds ago
1351 Islington Ave, Toronto
5 seconds ago
61 Sixteenth St, Toronto
5 seconds ago
51 Duncannon Dr, Toronto
6 seconds ago
11 Crispin Cres, Toronto
6 seconds ago
43 Sixteenth St, Toronto
7 seconds ago
AS SEEN ON


Are You a Licensed Real Estate Agent or Broker?